Results
1.Long-term drought characteristics of the LMRB
To investigate the temporal trend of droughts, we divided the past 119 years into two periods, i.e., 1901-1960 and 1961-2019. The distribution of frequency of severe and exceptional droughts in the LMRB based on SPEI12 (SPEI <-1.5) is shown in Figure 5. The results clearly indicate that severe and exceptional droughts occurred more frequently during the recent 59 years compared to its previous 60 years, and the recent 59-year results show that drought hot spots locate principally in the middle and upper parts of the Lancang sub-region. The occurring frequency of severe and exceptional droughts in LMRB is about 7%, and it reaches about 12% in the upper and middle areas of the Lancang sub-region during the past 59 years. For the downstream part of the LMRB, about half of the area experienced an increase of severe and exceptional droughts, which are located principally in Thailand, east Cambodia, and part of Viet Nam. Conversely, most areas of Lao PDR, west part of Cambodia, and part of the Mekong Delta area experienced a decrease of severe and exceptional droughts.
Also, we calculated the occurring frequency of severe and exceptional droughts in the recent 39 years by using SPI12 based on CHIRP dataset and the result is shown in Figure 6. This result confirms Fig. 5-b, which is that of the recent 59 years. The highest frequency happens in the upper and middle areas of the Lancang sub-region.
Share of drought occurred in the dry season and the wet season is shown in Table 5. For mild and above droughts (SPEI/SPI<-0.5), the share of the dry season is slightly higher than the wet season; For moderate and above droughts (SPEI/SPI<-1), the share of the dry season is significantly higher than the wet season.
Table 5. Share of drought occurred in dry season and wet season
|
Drought type |
Season |
SPEI3 |
SPI3 |
|
Mild and above (SPEI/SPI<-0.5) |
Dry |
54% |
58% |
|
Wet |
46% |
42% |
|
|
Moderate and above (SPEI/SPI<-1) |
Dry |
62% |
64% |
|
Wet |
38% |
36% |
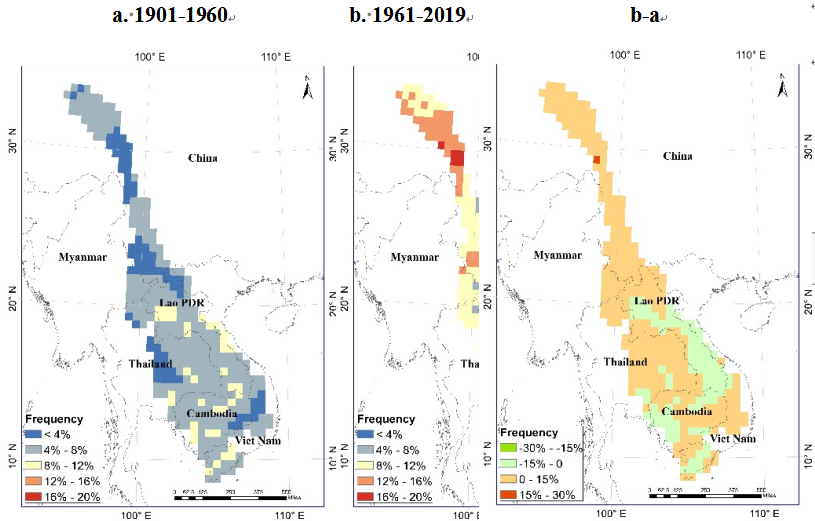
Figure 5. Frequency of severe and exceptional droughts in LMRB based on SPEI12

Figure 6. Frequency of severe and exceptional drought in LMRB based on SPI12 (1981-2019)
2. 2019 drought event
According to the meteorological data provided by CMA, the annual precipitation of 2019 in the Lancang River basin is 680.4mm, which is about 25% less than its long-term average, with that of April to June is 40% to 70%. ‘Weekly Flood Situation Report for the Mekong River Basin’ published by MRC shows that most parts of the river basin experienced drought and less rainfall from May 2019. The precipitation from June to October recorded in Chiang Sean, Luang Prabang, Nong Khai stations were 40%, 50%, and 20% less than the last few years respectively (MRC, 2019). In addition, the mainstream of Mekong River experienced the lowest water level from July to November compared with the same period in history.
Above descriptions can be confirmed by our analysis. Annual scale (12 months) of SPEI and SPI results both indicate that 2019 and 2015 are the most severe drought years in history, as shown in Figure 7.
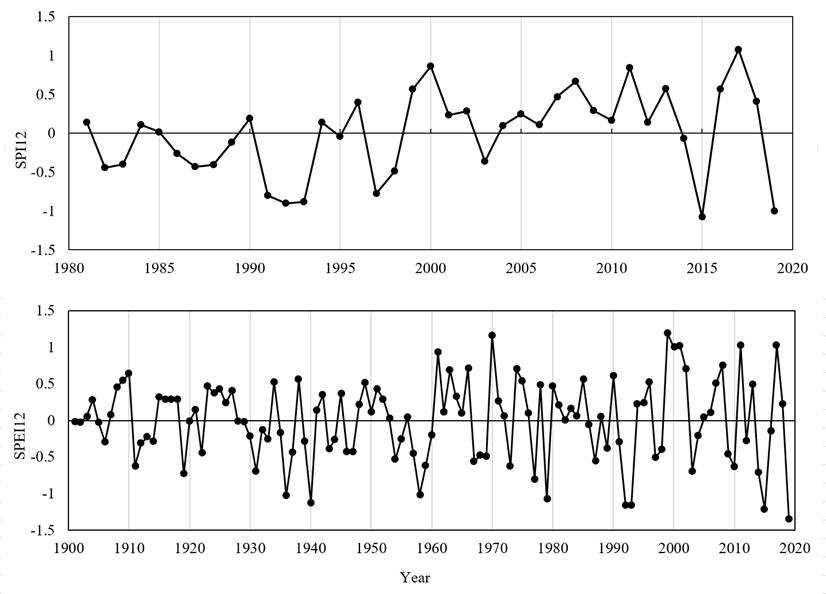
Figure 7. Dynamics of SPI12 (1981-2019) and SPEI12 (1901-2019) of the LMRB
The monthly SPEI3 and SPI3 sequence of Lancang River Basin and LMRB are shown in Figure 8. For the whole basin, the drought began in March 2019 and lasted until the end of the year. For the Lancang River Basin, the drought began in April and reached its peak in June. The severity of drought in Lancang River Basin was even more serious compared to the whole basin during the months of June and August based on SPEI index. However, the drought in the Lancang sub-region was relieved from September in 2019.
The monthly meteorological drought indices of LMRB in 2019 is shown in Figure 9 and Figure 10. It can be seen from the figures that the spatial distribution of SPEI3 and SPI3 has a good consistency, both indicating that serious drought began in April 2019 in the basin, and the drought hot spot is located from the lower reaches of Lancang River to the upper reaches of Mekong River (Nong Khai). The drought in Thailand on the western edge of the basin lasted for 12 months.
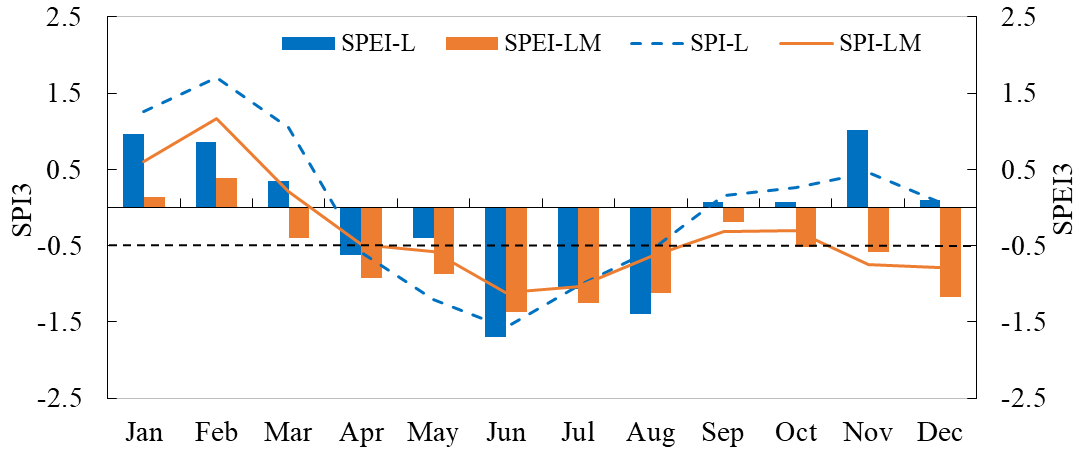
Figure 8. Drought index sequence of 2019 (L is Lancang River Basin; LM is LMRB)
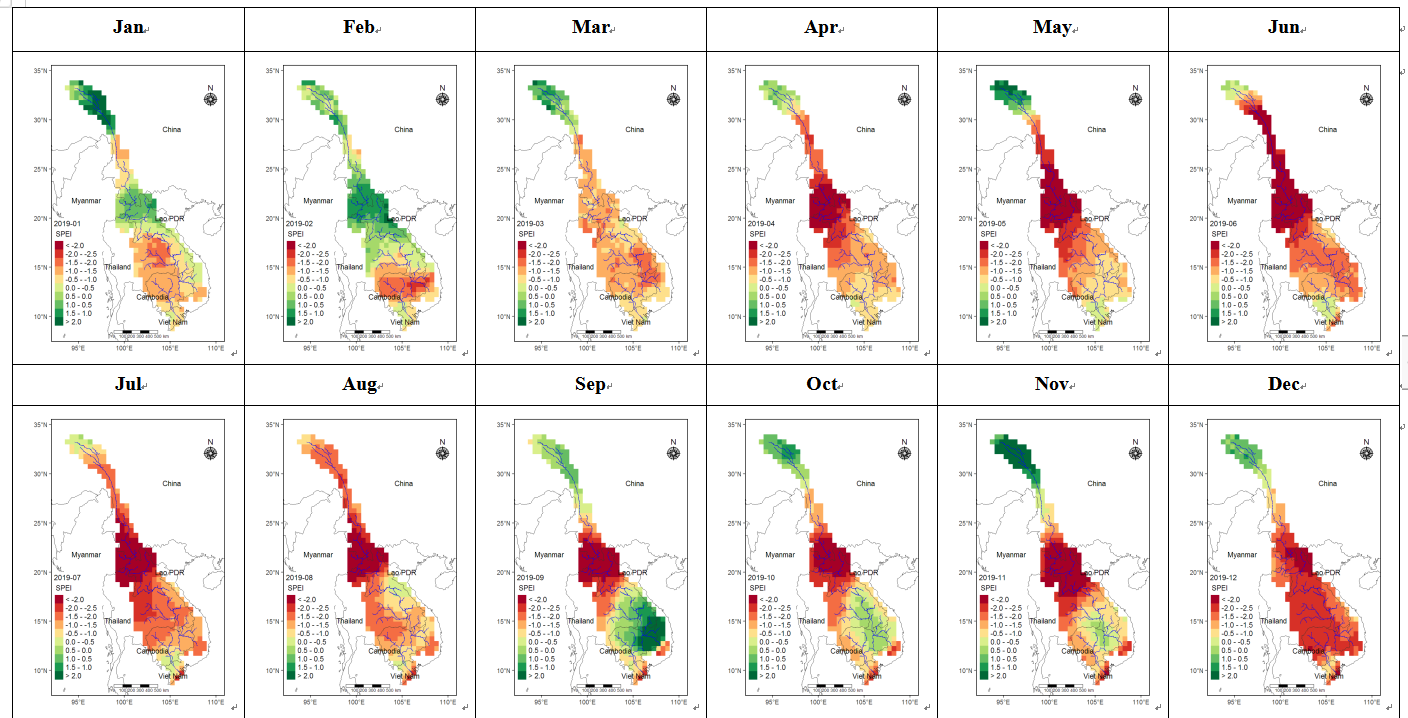
Figure 9. Monthly SPEI3 of LMRB in 2019 (based on CRU TS data).

Figure 10. Monthly SPI3 of LMRB in 2019 (based on CHIRPS data).
3.Natural Runoff composition of discharge along the Mekong River
Natural runoff was simulated from 1991 to 2019 based on the THREW model driven by gauge rainfall and satellite rainfall dataset, which is then used to calculate the contribution ratios of Lancang River and other 12 tributaries to annual runoff volume at 7 hydrological stations along the Mekong River. The results are listed in Table 6 and in Figure 11. Not surprisingly, the contribution ratio from Lancang River shows a decreasing trend with the increase of river distance. The ratio is 64.4% at Chiang Saen (354 km from Jinghong), 24.9% in Nakhon Phanom (1497 km from Jinghong), and 14.3% in Stung Treng (1851 km from Jinghong). At Stung Treng Hydrological Station, the main tributaries contribute substantial water volume to the mainstream include Se Kong, Nam Ngum, Nam Mun, Se San, and Sre Pok. To be noted, the contribution ratios we obtained based on the distributed hydrological model are similar to the reported values by MRC, which are calculated based on long term measurements prior to the commission of major dams as listed in Table 6.
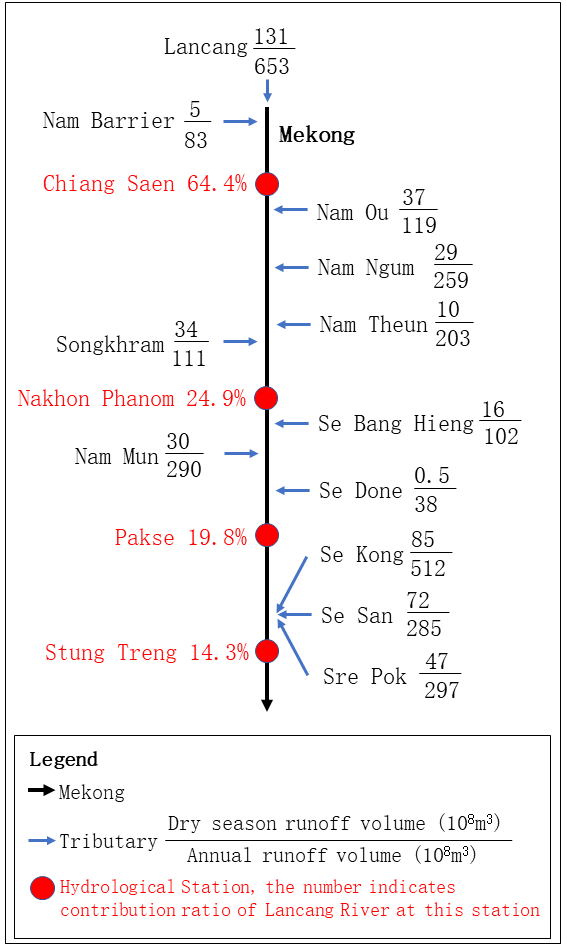
Figure 11. Runoff volume from major tributaries and contribution ratio of Lancang River
|
Contributing tributary Hydrological station |
Lancang |
Nam Barrier |
Nam Ou |
Nam Ngum |
Nam Theun |
Nam Songkhram |
Se Bang Hieng |
Se Done |
Nam Mun |
Se San |
Se Kong |
Sre Pok |
|
Chiang Saen |
64.4 |
8.6 |
- |
- |
- |
- |
- |
- |
- |
- |
- |
- |
|
Luang Prabang |
45.2 |
6.0 |
8.1 |
- |
- |
- |
- |
- |
- |
- |
- |
- |
|
Nong Khai |
39.5 |
5.3 |
7.1 |
- |
- |
- |
- |
- |
- |
- |
- |
- |
|
Nakhon Phanom |
24.9 |
3.3 |
4.5 |
8.2 |
6.9 |
4.8 |
- |
- |
- |
- |
- |
- |
|
Mukdahan |
22.9 |
3.0 |
4.2 |
7.5 |
6.3 |
4.4 |
- |
- |
- |
- |
- |
- |
|
Pakse |
19.8 |
2.6 |
3.6 |
6.4 |
5.4 |
3.8 |
2.6 |
0.9 |
6.8 |
- |
- |
- |
|
Stung Treng |
14.3 |
1.9 |
2.6 |
4.6 |
3.9 |
2.7 |
1.9 |
0.7 |
4.9 |
5.8 |
8.9 |
6.7 |
|
Contribute ratio (%) at Stung Treng reported by MRC |
16.5 |
- |
3.1 |
4.9 |
5.7 |
2.4 |
3.4 |
1.4 |
5.6 |
4.0 |
8.2 |
6.6 |
Table 6. Contribution ratio (%) of major tributaries to annual runoff at seven hydrological stations along the Mekong River (1991-2019)
* Runoff from Lancang River means the discharge at Jinghong Station
3.4 Impacts of reservoir regulation on mainstream discharge
Table 7 presents the simulated annual runoff volume at Stung Treng Hydrological Station from 2001 to 2019 driven by IMERG rainfall data. The result shows that the year 2019 witnessed the lowest runoff volume since 2001, which means the most severe hydrological drought year during the recent 19 years. This partly confirms the conclusion obtained from long-term drought analysis.
Figure 12 shows the natural (simulated) and observed regime curve (average monthly runoff volume) at Chiang Saen Hydrological Station during 2001-2019. As one of the largest dams, Xiaowan dam, put into operation in 2010, two time periods are defined to investigate the impacts of reservoir regulation on the streamflow, i.e., 2001-2009 and 2010-2019. The natural and observed regime curves for 2001-2009 are almost identical, which means the hydrological model performs well under no reservoir condition. Also, the nature and observed regime curves during 2010-2019 clearly shows that reservoir operation reduces the runoff during the rainy season and supplement the runoff during the dry season.
Table 7. Annual precipitation and simulated runoff at Stung Treng from 2001 to 2019
|
Year |
2001 |
2002 |
2003 |
2004 |
2005 |
2006 |
2007 |
2008 |
2009 |
2010 |
|
Runoff (billion m3) |
325.1 |
338.7 |
273.5 |
282.8 |
313.8 |
341.1 |
312.2 |
292.4 |
286.5 |
278.1 |
|
Precipitation (mm) |
1732 |
1676 |
1494 |
1528 |
1617 |
1681 |
1653 |
1716 |
1540 |
1489 |
|
Year |
2011 |
2012 |
2013 |
2014 |
2015 |
2016 |
2017 |
2018 |
2019 |
|
|
Runoff (billion m3) |
368.8 |
277.5 |
317.5 |
324.0 |
274.3 |
285.2 |
334.0 |
346.0 |
262.5 |
|
|
Precipitation (mm) |
1775 |
1540 |
1712 |
1568 |
1424 |
1650 |
1753 |
1710 |
1010 |
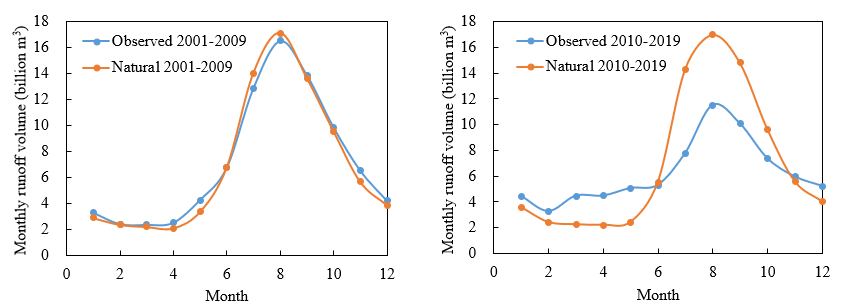
Figure 12. Natural and observed regime curves at Chiang Saen Hydrological Station